Broh5’s documentation
Broh5 is a GUI (Graphical User Interface) software for viewing HDF/H5/NXS files. Unlike previous viewers built with various languages and platforms, Broh5’s UI components are based on web browsers but the software written entirely in Python, thanks to the NiceGUI framework.

Source code: https://github.com/algotom/broh5
Author: Nghia T. Vo - NSLS-II, Brookhaven National Laboratory, US.
Keywords: HDF Viewer, Browser-based GUI.
Features
A browser-based GUI software for viewing HDF (Hierarchical Data Format) file written in pure Python with minimal codebase.
The software provides essential tools for viewing hdf files such as: displaying tree structures or paths to datasets/groups; and presenting datasets as values, images, plots, or tables. Users also can save datasets to images or csv formats.
Broh5 can view compressed hdf files by using compressors from hdf5plugin.
The codebase is designed using the RUI (Rendering-Utilities-Interactions) concept, which is known as the MVC (Model-View-Controller) pattern in the GUI development community. This design allows for the development of complex software and makes it easier to extend its capabilities.
Usage
Users can open a hdf file by clicking the “Select file” button. Multiple hdf files can be opened sequentially.
Upon opening, the tree structure of the current hdf file is displayed, allowing users to navigate different branches (hdf groups) or leaves (hdf datasets). The path to datasets/groups is also displayed. If a dataset contains a string or a single float/integer value, it will be shown.
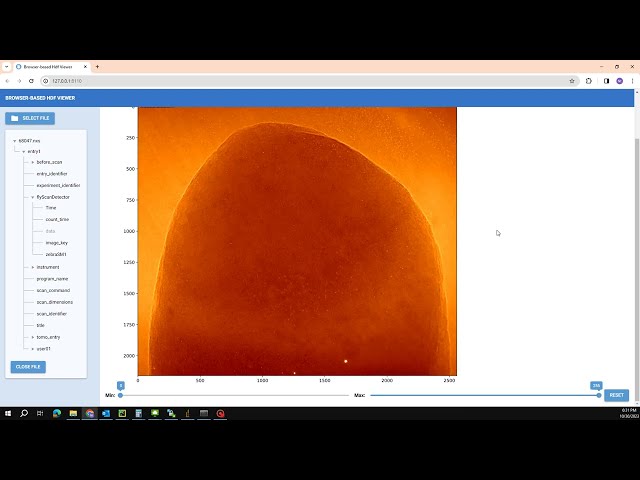
If dataset is a 3D array, it’s presented as an image. Users can slice through various images and adjust the contrast. Slicing is available for different axes; however, for large datasets, slicing along axis 2 is disabled due to processing time. Starting from version 1.3.0, users can choose to display a zoomed area of the current image or the intensity profile across a mouse-clicked location.
Datasets that are 1D or 2D arrays will be shown as plots or tables, selectively.
Users have the option to save images or tables to disk.
Video demonstration: